Information
about the TIMES study

Read in other languages:
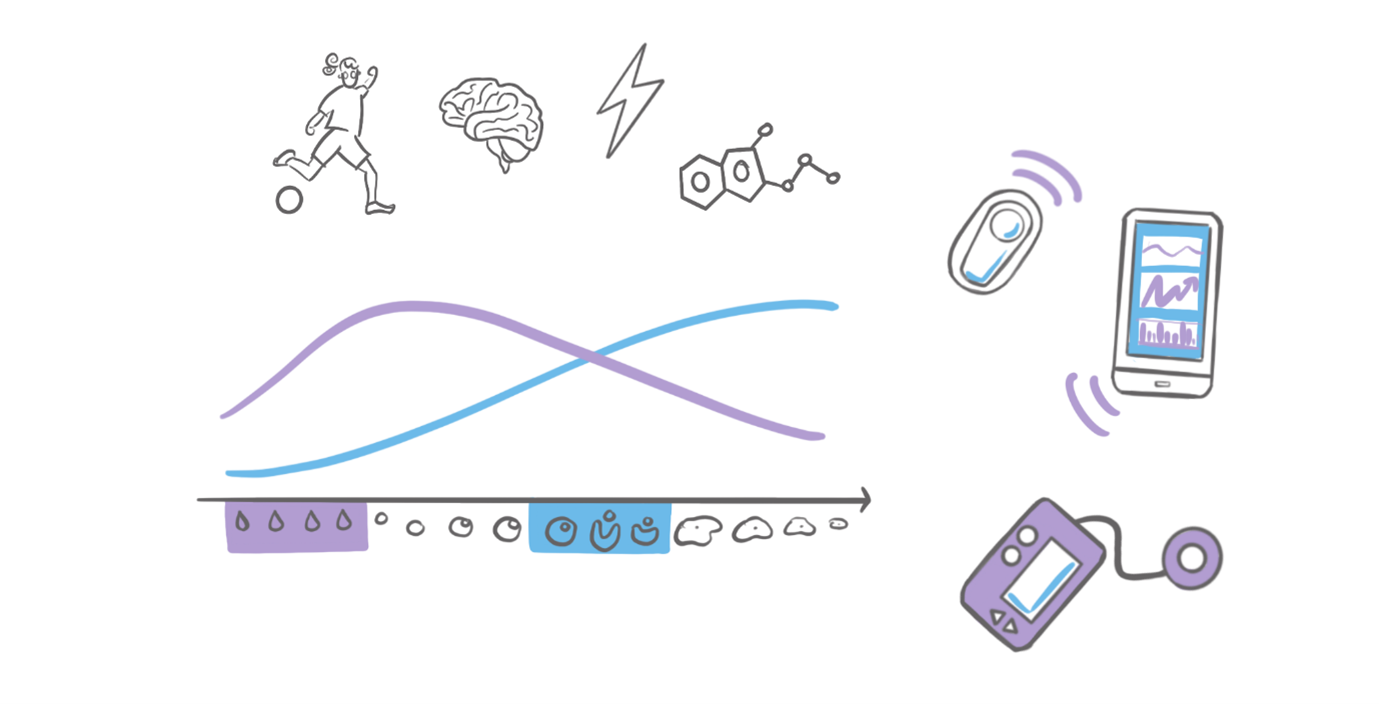
The TIMES study is being conducted by the Diabetes Center Berne (DCB) and aims to gain a better understanding of type 1 diabetes (T1D) throughout the menstrual cycle.
This could ultimately improve the quality of life for women with T1D.
If you are interested in participating, find more information on the study:

About us as DCB
The TIMES study is being conducted by the Diabetes Center Berne (DCB). The DCB is a non-profit foundation based in Bern, Switzerland, whose goal is to improve the lives of people with diabetes.
Aim of the study
The aim of this study is to gain a better understanding of how insulin sensitivity changes over the course of the menstrual cycle in women with type 1 diabetes (T1D). We are trying to identify patterns in how insulin requirements change over the course of the cycle, with the hope of promoting more personalized diabetes care.

This could ultimately help women with T1D achieve better health outcomes and improve their quality of life.
Background
Premenopausal women with type 1 diabetes (T1D) often experience changes in blood sugar control related to their menstrual cycle. These natural hormone fluctuations can make diabetes management difficult, especially since current AID systems are not designed to adjust insulin delivery in response to these monthly hormonal changes.
The TIMES study was developed to gain robust scientific insights into how insulin requirements and blood glucose control change during the menstrual cycle. The multinational study is being conducted in a decentralized manner and includes a total of 350 women, approximately 50 each in Switzerland, Denmark, the UK, the US, and Germany. As this is a decentralized study, all study-related activities take place online or at the participants’ homes. It is not necessary to visit a clinic or medical center.

By collecting real-world data (data from everyday life) from participants’ automated insulin delivery systems (AID systems), we can obtain much of the information needed to understand how insulin requirements and blood sugar levels fluctuate during the menstrual cycle. This is supplemented by data that participants themselves enter in surveys, such as information on menstrual cycles, symptoms and lifestyle habits.
Our goal is to identify typical patterns in insulin requirements and blood glucose levels, including time in range, hypo- and hyperglycaemia, during the different phases of the menstrual cycle. We also want to understand which factors, such as premenstrual symptoms or the level of physical activity, significantly influence or characterise these fluctuations.
We are conducting the study in accordance with Swiss law. We also comply with all internationally recognised guidelines. The responsible ethics committee has reviewed and approved the research project.
What exactly does participation in a study involve?
This study is conducted exclusively from home, meaning that all study-related activities can be completed at home. We ask participants to collect data on their diabetes management and menstrual cycle over six menstrual cycles (participation can therefore last up to seven months). You will be asked to complete several questionnaires. You will also be asked to provide or upload data from your AID system, including information on glucose levels, insulin doses and carbohydrate intake. We will provide you with a Garmin smartwatch, which you should wear throughout the study (including at night), and you will need to perform ovulation tests to determine your ovulation in each cycle (up to 10 ovulation tests per month).
More details about the study processes can be found in this study information.
What are the risks and inconveniences associated with participating in a study?
There are only minimal risks associated with this study:
- Data protection and data security: Although we use secure systems, there is a small risk of data breaches. However, all data is encrypted and stored securely to protect your privacy as much as possible.
- Time and effort: Participation requires regular uploading of data and completion of questionnaires, which may be perceived as inconvenient or cumbersome.

What about my confidentiality and data protection?
All data protection requirements are strictly adhered to. The study data is stored securely in REDCap® in Switzerland in compliance with the Swiss Data Protection Act (revDSG). The data available in the Clue app and Garmin app is also stored in the European Union under the General Data Protection Regulation (GDPR). These laws are very similar.
It is possible that your data may need to be transmitted in encrypted form, for example for publication, and made available to other researchers.

Will I receive compensation for my participation?
You will receive £50 per cycle for which you provide high-quality data. In total, you can receive up to £300.
This remuneration will be transferred to you at the end of your participation in the study and depends on the completeness of your data. As data quality is crucial to the success of this study, we ask that you follow the instructions as closely as possible.
If we find that your data is incomplete, we will provide you with feedback. We are pleased to recognise all your efforts that contribute to the success of this study. The results of this research project may contribute to the development of new commercial products. Your participation does not entitle you to any claims on commercial developments (e.g. patents).

Frequently asked questions
Why was I told that I am not eligible to participate?
We greatly appreciate your interest. Unfortunately, either your initial information did not meet the study’s eligibility requirements, or the information collected during your initial data entry indicated that you no longer meet the requirements. If you wish, you can send us an email at times@dcberne.com and we will be happy to explain further.
I am interested in the TIMES study – what should I do next?
If you have read about the study and are interested, simply follow this link to continue.
Under this link you will find the participant information sheet, which contains further information about the TIMES study.
If you have any questions or comments, please send us an email: times@dcberne.com. We are here to provide you with all the information you need.
How can I download my data from my AID system?
Here you can find the instructions for exporting data from:
If your system is not listed, please contact the TIMES Study Team for assistance!
Clue App – How it works and what to do
In the TIMES study, the Clue app helps you track your cycle and symptoms. Please follow the instructions to create your account and start tracking.
Garmin: How to install the tracker?
In the TIMES study, we also ask you to wear the Garmin watch to track yourphysical activity. Please follow the step-by-step instruction for setting up yourGarmin device.
However, you may also continue using any other activity tracker you currentlyuse (with the specified exception of Apple Watches).
Study Messaging Terms and Conditions
- You will only receive study-related communications.
- Your contact information will not be shared, rented or sold to third parties.
- Expected frequency: once per day on average.
- Reply STOP or UNSUBSCRIBE to opt out.
- Type START or UNSTOP to opt back in.
- Message and data rates may apply.
- For support, contact times@dcberne.com
- Please refer to our Privacy Policy in Clinical Studies for all details.
Supported by










But could the same data tell us much more about a person's health than we currently realise?
A new study published in npj Digital Medicine suggests that looking beyond individual glucose readings could reveal patterns associated with diabetes-related health risks. The findings point towards an interesting possibility: CGM technology may one day help us understand glucose levels, and also identify individual risk profiles and support more personalised diabetes care.
What did the researchers discover?
The researchers analysed CGM data from 90,757 participants in the iCanNet cohort, including people with normoglycemia, prediabetes, type 1 diabetes and type 2 diabetes. Rather than looking at individual glucose values alone, they examined 48 different CGM-derived metrics, including glucose variability and patterns over time. Their analysis revealed distinct glucose patterns across the different groups. Combining several metrics also improved the researchers' ability to distinguish between them.
Particularly interesting were the findings among people living with type 2 diabetes.
The researchers identified four distinct glycemic phenotypes – different patterns of glucose levels and fluctuations – associated with varying risks of diabetes-related complications.
For example:
- Sustained high glucose levels were associated with a 59% higher relative risk of acute complications.
- High glucose variability was associated with a 75% higher relative risk of acute complications and a 41% higher relative risk of chronic complications.
The researchers also developed a Digital Glycemic Risk Score (DGRS), combining multiple CGM metrics to identify people with potentially elevated risks.
Among participants with type 2 diabetes who had already achieved a Time in Range of at least 70%, the model reclassified 25% into a high-risk category for acute complications and 22.3% into a high-risk category for chronic complications. These were classifications generated by the model, not confirmed predictions of complications occurring in these individuals.
The findings suggest that combining different glucose patterns may reveal information about health risks that commonly used CGM metrics alone do not fully capture.
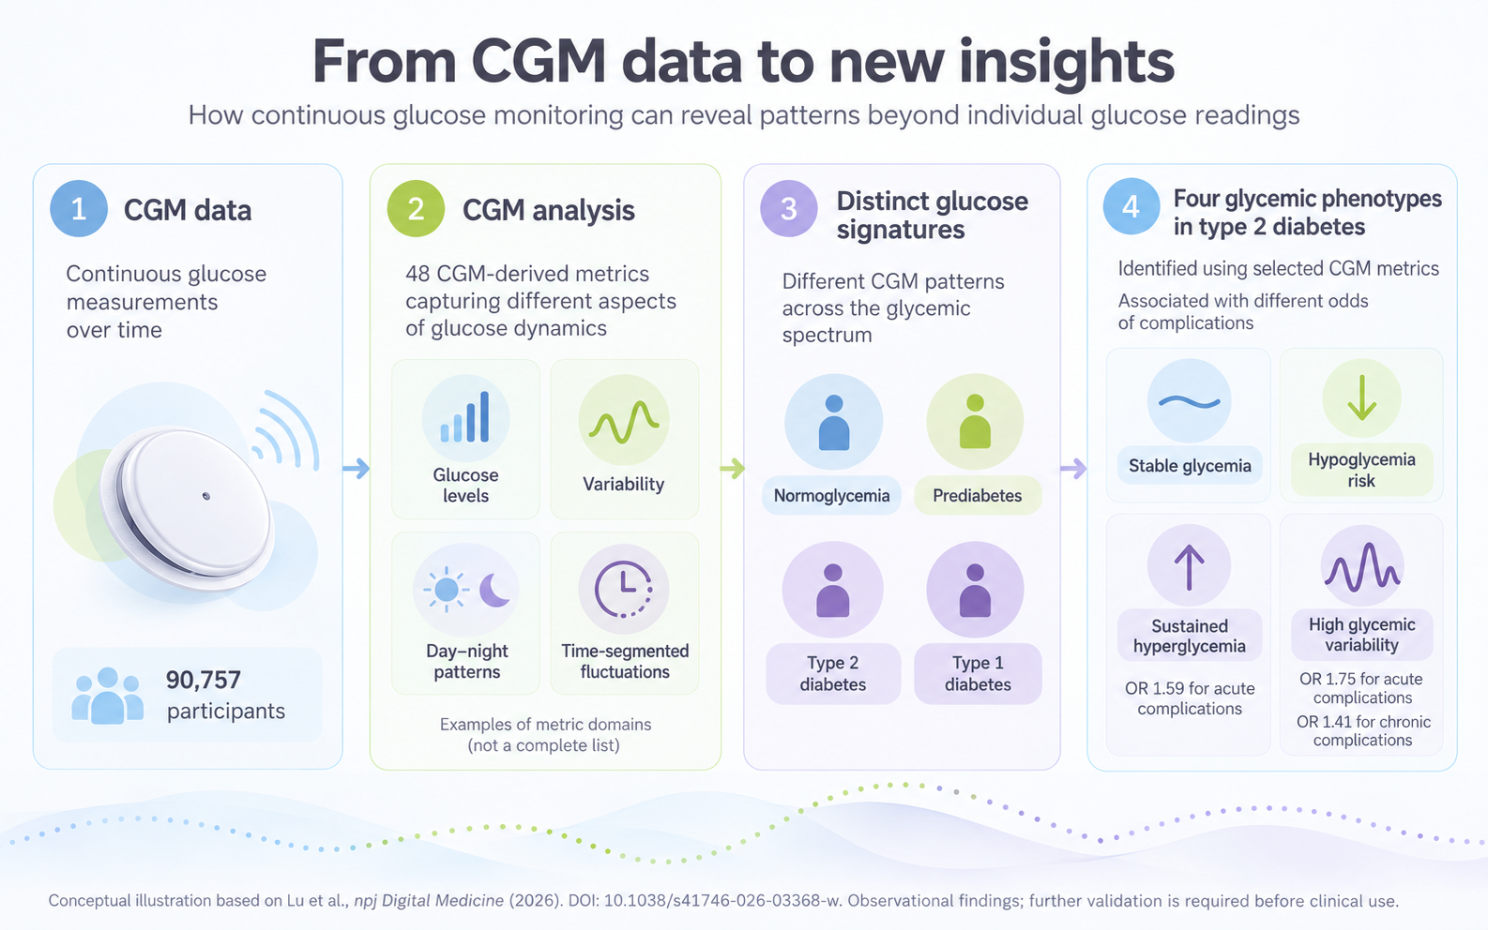
From CGM data to new insights. The study analysed 48 CGM-derived metrics from 90,757 participants and identified distinct glucose patterns across the diabetes spectrum. Among people with type 2 diabetes, four glycemic phenotypes were associated with
What could this mean for diabetes care?
Today, CGM systems primarily help people understand what is happening with their glucose levels and respond accordingly. But the enormous amount of data these devices generate may hold additional information that we are only beginning to explore.
By analysing glucose patterns over time, researchers may be able to develop digital biomarkers – measurable indicators derived from digital health data – that could help characterise individual metabolic profiles and identify potential health risks.
In the future, this could support healthcare professionals in recognising people who may benefit from closer monitoring or more personalised treatment approaches.

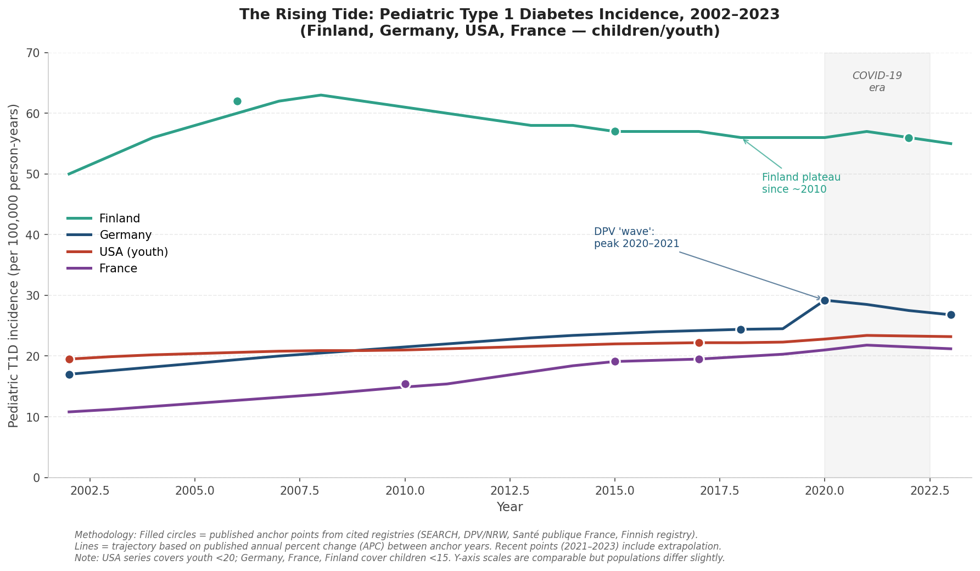
The Nordic region remains the global hotspot for childhood‑onset T1D. Finland has historically reported the highest incidence worldwide – around 60 per 100,000 children per year – although this rate appears to have stabilised or slightly declined since the early 2000s. Sweden, Norway and Denmark follow closely, and the IDF Diabetes Atlas 11 still places Finland, Sweden and Norway among the global top ten for published incidence.
A 2024 systematic review of European paediatric data (1994–2022) confirmed that the Nordic countries retain the highest absolute incidence in Europe, even as their rate of increase has slowed relative to the rapid rise in previously low‑incidence Central and Eastern European countries. A Swedish nationwide cohort study of 2.9 million children found that the heritability of childhood‑onset T1D has remained high and stable at around 0.83 over 30 years, implying that known environmental factors explain less than 10% of the observed rise.
In France, Santé publique France reports an annual T1D incidence increase of approximately 4%. Paediatric incidence rose from 15.4 to 19.1 per 100,000 person‑years between 2010 and 2015, with an overall rate of 19.5 per 100,000 in 2015–2017 and substantial regional variation. Sardinia (Italy) now reports the world’s highest published paediatric incidence at 76.3 per 100,000 (2022), having overtaken Finland, while the United Kingdom and Ireland also remain in the global top ten.
Projections to 2050
Two major modelling efforts suggest the same direction of travel. The GBD 2021 study projects that age‑standardised global type 1 diabetes prevalence will rise by about 23.9% between 2021 and 2050, a smaller relative increase than for type 2 diabetes, but a substantial absolute rise given the lifelong management burden of T1D. The IDF Diabetes Atlas 11 projects that overall adult diabetes prevalence (type 1 and type 2) will grow from 589 million in 2024 to around 853 million by 2050, a 46% absolute increase. While most of this growth is driven by type 2 diabetes, T1D contributes meaningfully through sustained or rising incidence in high‑income countries and improved survival, which increases prevalence even if incidence stabilises.
For the U.S., a modelling exercise based on SEARCH data suggests that, under a linear‑increase scenario, the number of young people with T1D could nearly triple by 2050, with the steepest relative growth among Hispanic and Black children.
Why is incidence rising?
T1D is a polygenic autoimmune disease in which environmental triggers act on a susceptible genetic background. Several, often overlapping, hypotheses are under investigation:
- Reduced early‑life exposure to common infections (“hygiene hypothesis”), with mixed evidence.
- Rising childhood adiposity and insulin resistance, which may accelerate the clinical presentation of existing islet autoimmunity (“accelerator hypothesis”).
- Viral triggers such as enteroviruses and, more recently, SARS‑CoV‑2, where meta‑analyses report a 14–27% increase in paediatric T1D incidence during the pandemic.
- Dietary and microbiome‑related factors, including early cow’s‑milk exposure, gluten timing and shifts in the infant gut microbiome.
- Vitamin D status and latitude, endocrine‑disrupting chemicals, pollution and perinatal factors such as higher maternal age, higher birth weight and Caesarean delivery.
The Swedish cohort study mentioned above is a stark reminder of how much remains unexplained: even with population‑wide data on several environmental exposures, less than 10% of the rise in T1D incidence in Sweden could be attributed to known factors. This underscores the need for long‑term birth cohorts, population‑level islet‑autoantibody screening and mechanistic immunology.
Implications for the next decade
Three practical implications stand out for health systems, innovators and the diabetes community:
- Health systems need to prepare for more people living with type 1 diabetes. Even under conservative assumptions, the number of people living with type 1 diabetes will continue to rise. This has practical consequences for insulin and sensor supply, reimbursement for diabetes technology, specialist care and clinical-trial infrastructure.
- Early detection is becoming more relevant. Type 1 diabetes can often be detected before symptoms appear, through markers of early autoimmune activity. With the first therapy now approved to delay clinical onset in people at an early disease stage, screening is no longer only a research question. Programmes such as Fr1da in Germany and the D1Ce trial in Italy show how early identification could inform future intervention strategies.
- We still need to understand why incidence is rising. Many environmental factors are being studied, but no single explanation is sufficient. Until we better understand the drivers behind the increase, true primary prevention will remain out of reach. This makes high-quality registries, long-term cohort studies and coordinated research more important than ever.
At DCB, we see these trends as both a warning and a call to action.
The rising incidence of type 1 diabetes will require sustained collaboration between clinicians, researchers, industry, policymakers and crucially people living with diabetes and their families.
Our work in innovation, clinical research infrastructure and community engagement aims to contribute to that collective effort.
Selected sources
GBD 2021 Diabetes Collaborators. Global, regional, and national burden of diabetes from 1990 to 2021, with projections of prevalence to 2050. The Lancet, 2023. https://www.thelancet.com/article/S0140-6736(23)01301-6/fulltext
International Diabetes Federation. IDF Diabetes Atlas, 11th edition. 2025. https://diabetesatlas.org/
Ogle GD, et al. Global type 1 diabetes prevalence, incidence, and mortality estimates 2025: Results from the IDF Atlas 11 and the T1D Index v3.0. Diabetes Research and Clinical Practice, 2025. https://www.sciencedirect.com/science/article/pii/S0168822725002918
Stahl-Pehe A, et al. Wave in Pediatric Type 1 Diabetes Incidence After the Emergence of COVID-19: Peak and Trough Patterns in German Youth — DPV Registry. Diabetes Care, 2025. https://diabetesjournals.org/care/article/48/4/e47/157803/
Buchmann M, et al. Type 1 diabetes incidence curves differ by age for girls and boys between 1996 and 2022: Results from the North Rhine-Westphalia Diabetes Registry. Diabetes Research and Clinical Practice, 2025. https://www.sciencedirect.com/science/article/pii/S0168822725000105
Nagl K, et al. Ongoing Increase in Incidence of Diabetes in Austrian Children and Adolescents 1989–2021. Pediatric Diabetes, 2023. https://www.ncbi.nlm.nih.gov/pmc/articles/PMC12017070/
Schoenle EJ, et al. Epidemiology of Type I diabetes mellitus in Switzerland: Steep rise in incidence in under-5 year old children in the past decade. Diabetologia, 2001. https://www.researchgate.net/publication/12017578
Santé publique France. Diabetes — Data. Updated 2024. https://www.santepubliquefrance.fr/en/diabete/data
Piffaretti C, et al. Trends in childhood type 1 diabetes incidence in France, 2010–2015. Diabetes Research and Clinical Practice, 2018. https://www.sciencedirect.com/science/article/abs/pii/S0168822718304662
Ruiz-Grao MC, et al. Trends in the Incidence of Type 1 Diabetes in European Children and Adolescents from 1994 to 2022: A Systematic Review and Meta-Analysis. Pediatric Diabetes, 2024. https://onlinelibrary.wiley.com/doi/10.1155/2024/2338922
Ji J, et al. Stable heritability of type 1 diabetes in a Swedish Nationwide Cohort Study. Nature Communications, 2024. https://www.ncbi.nlm.nih.gov/pmc/articles/PMC12174315/
D’Souza D, et al. Incidence of Diabetes in Children and Adolescents During the COVID-19 Pandemic: A Systematic Review and Meta-Analysis. JAMA Network Open, 2023. https://www.ncbi.nlm.nih.gov/pmc/articles/PMC10314307/
Quinn LM, et al. Environmental Determinants of Type 1 Diabetes: From Association to Proving Causality. Frontiers in Immunology, 2021. https://www.ncbi.nlm.nih.gov/pmc/articles/PMC8518604/
Esposito S, et al. Changes in the Global Epidemiology of Type 1 Diabetes in an Evolving Landscape of Environmental Factors. International Journal of Molecular Sciences, 2023. https://www.ncbi.nlm.nih.gov/pmc/articles/PMC10141720/
Rogers MAM, et al. Fluctuations in the incidence of type 1 diabetes in the United States from 2001 to 2015: a longitudinal study. BMC Medicine, 2017. https://www.ncbi.nlm.nih.gov/pmc/articles/PMC5688827/
Imperatore G, et al. Projections of Type 1 and Type 2 Diabetes Burden in the U.S. Population Aged <20 Years Through 2050. Diabetes Care, 2012. https://pmc.ncbi.nlm.nih.gov/articles/PMC3507562/
We hope this overview is helpful for your own work in diabetes care, research or advocacy. As always, we are grateful for your interest in and support of our activities and we look forward to continuing this conversation with you in future editions of our “DID YOU KNOW…” series.
An earlier version of this article was originally published in the private newsletter of our CEO, Derek Brandt here: Diabetes Technology News.
This post was previously published in Linkedin. Click here to see the original publication.


DCB Research AG
Freiburgstrasse 3
3010 Bern
Schweiz